 |

The NAMES Project AIDS quilt, representing
people who have died of AIDS, in front of the Washington Monument.
Courtesy of the National Institutes of Health.
Global Update
Since the beginning of the epidemic, almost 70 million people have been infected with the HIV virus and about 35 million people have died of AIDS (WHO, 2013a). Globally, 34.0 million [31.4–35.9 million] people were living with HIV at the end of 2011. An estimated 0.8% of adults aged 15-49 years worldwide are living with HIV, although the burden of the epidemic continues to vary considerably between countries and regions. Sub-Saharan Africa remains most severely affected, with nearly 1 in every 20 adults (4.9%) living with HIV and accounting for 69% of the people living with HIV worldwide.
In 2011, more than 8 million people living with HIV were receiving antiretroviral therapy (ART) in low- and middle-income countries. Another 7 million people need to be enrolled in treatment to meet the target of providing ART to 15 million people by 2015 (WHO, 2013a).
Courtesy CDC, http://www.cdc.gov/globalaids/wad/default.html
Reported HIV/AIDS Cases in the US
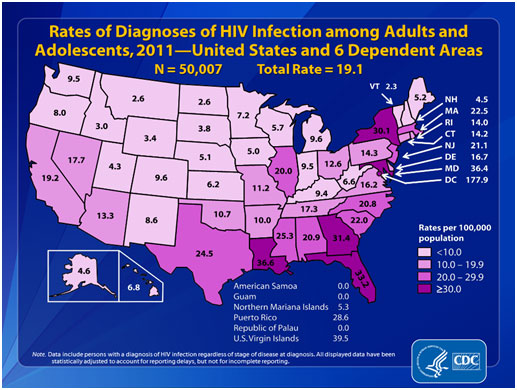
From 2008 through 2011, the annual estimated number and rate of diagnoses of HIV infection remained stable in the United States, at approximately 50,000 new cases per year (CDC, 2013). In 2011, an estimated 49,273 people were diagnosed with HIV infection in the United States. In that same year, an estimated 32,052 people were diagnosed with AIDS. Since the epidemic began, an estimated 1,155,792 people in the United States have been diagnosed with AIDS (CDC, 2013). In 2011, the estimated rate of HIV infection was 15.8 (per 100,000 population). The areas with the highest rates were in the South, a few states in the Northeast (i.e., Massachusetts, New Jersey, and New York), Illinois, Puerto Rico, and the U.S. Virgin Islands (CDC, 2012).
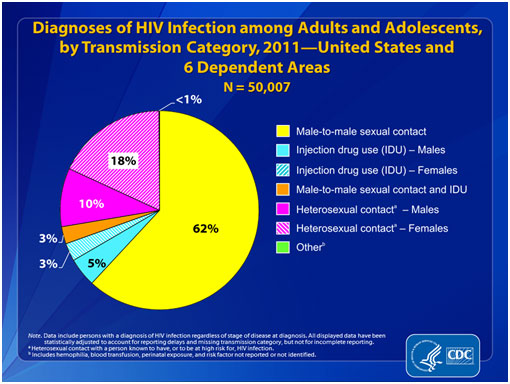
From 2008 through 2011, among adult and adolescent males, the annual number of diagnosed HIV infections attributed to male-to-male sexual contact increased. The numbers of infections attributed to injection drug use, to male-to-male sexual contact and injection drug use, and to heterosexual contact decreased. Among adult and adolescent females, the numbers of infections attributed to injection drug use and to heterosexual contact decreased. In 2011, diagnosed infections attributed to male-to-male sexual contact (65%, including male-to-male sexual contact and injection drug use) and those attributed to heterosexual contact (27%) accounted for approximately 92% of diagnosed HIV infections in the United States (CDC, 2012).
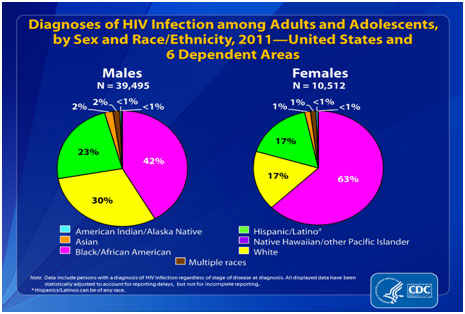
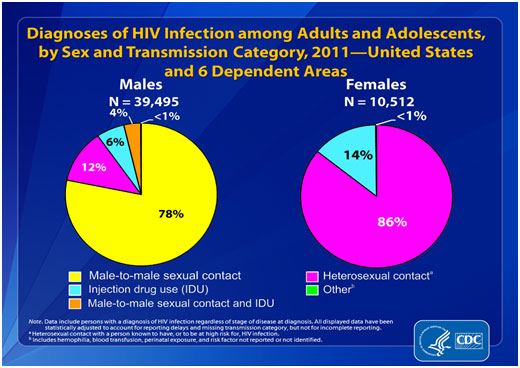
From 2008 through 2011, the rate for females decreased; the rate for males remained stable. In 2011, males accounted for 79% of all diagnoses of HIV infection among adults and adolescents. The rate for adult and adolescent males was 30.8, and the rate for females was 7.7 (CDC, 2012).
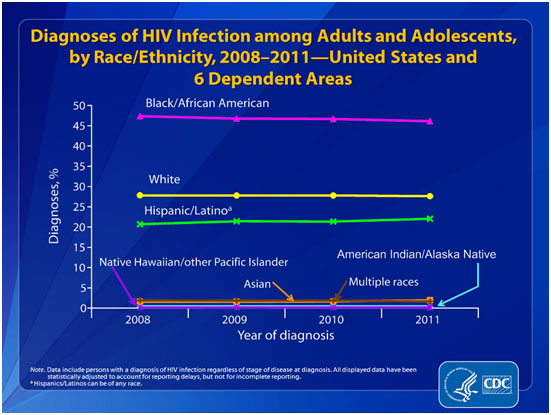
From 2008 through 2011, the rate for Asians increased. The rates for blacks/African Americans, Hispanics/Latinos, Native Hawaiians/other Pacific Islanders, and persons of multiple
races decreased. The rates for American Indians/Alaska Natives and whites remained stable. In 2011, the rates were 60.4 for blacks/African Americans, 19.5 for Hispanics/Latinos, 15.3 for Native Hawaiians/other Pacific Islanders, 14.2 for persons of multiple races, 9.3 for American Indians/Alaska Natives, 7.0 for whites, and 6.5 for Asians. Data for Native Hawaiians/other Pacific Islanders should be interpreted with caution because numbers are small (CDC, 2012).
There is not one single reason that stands out as to why the disparities exist. One factor is health disparities, which are linked to socioeconomic conditions. Another factor is distrust of the healthcare system. Both legacies of the past and current issues of race mean that many people of color do not trust "the system" for a variety of reasons. Thus, even when income is not a barrier, access to early intervention and treatment may be limited. And HIV may be only one of a list of problems, which also include adequate housing, food, employment, etc.
Another factor may be the diversities within these populations. Diversity is evident in immigrant status, religion, languages, geographic locations and, again, socioeconomic conditions. Getting information out in appropriate ways to these diverse populations is challenging.
There is a significant amount of denial about HIV risk, which continues to exist in these communities. As with other groups, there may also be fear and stigmatization of those who have HIV. Prevention messages must be tailored and presented in a culturally and linguistically appropriate manner. The messages must be carried thorough channels that are appropriate for the individual community. These channels may include religious institutions or through respected elders in the community. Ironically, it may be these institutions or elders who, in the past, have contributed to the misinformation and stigma associated with HIV. Many HIV prevention programs are recognizing the importance of working with diverse communities. Input from these communities must be included in planning, delivering, and evaluating HIV prevention activities.
More infections occurred among young people under 30 than any other age group. From 2008 through 2011, the rates for persons aged 20–24 and 25–29 increased. In 2011, the highest rate was for persons aged 20–24 years (36.4), followed by persons aged 25–29 years (35.2).
The rates for persons aged 30–34, 35–39, 40–44, 45–49, 55–59, and 60–64 decreased. The rates remained stable for children (aged less than 13 years) and persons aged 13–14, 15–19, 50–54, and 65 and older.
HIV/AIDS in Kentucky
As of June 30, 2012, a total of 8,513 cumulative HIV infections had been reported among Kentuckians to the Department for Public Health’s HIV/AIDS Surveillance Program since AIDS reporting started in 1982. The number of new HIV infections over the most recent 10.5 years for which data are available is presented in Table 6. HIV name-based reporting was introduced in mid-2004 and reporting has increased and stabilized since then. Of the 3,423 HIV infections diagnosed since 2002, 1,576 (46%) had progressed to AIDS as of June 30, 2012.
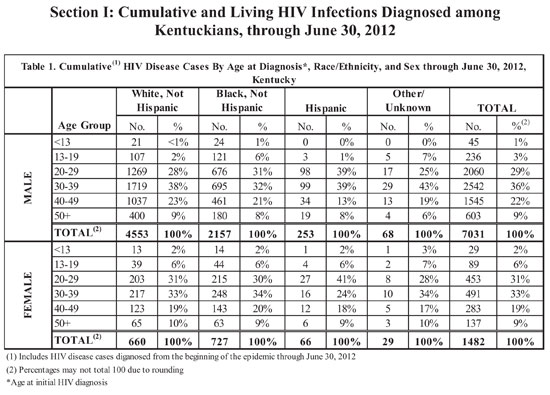
Since the beginning of the epidemic in the early 80’s, the majority of HIV infections diagnosed in Kentucky have been reported among males (7,031, 83%). More male HIV infections were diagnosed in their 30s (2,542, 36%) than any other decade. Among white males and black males, the highest percentages of cumulative cases were aged 30-39 years at the time of diagnosis: whites 38%; blacks, 32%. Hispanic males had a similar percentage of cases aged 20-29 years and 30-39 years at time of diagnosis, 39% (KCHFS, 2013).
The percentage of Hispanic males in their 20s at time of diagnosis (39%) was higher compared to blacks (31%) and whites (28%). Conversely, Hispanic males had the lowest percentage of cases aged 40-49 years at time of diagnosis (13%), compared with black males and white males (21% and 23% respectively). Six percent of black males were teenagers at time of diagnosis compared to 2% of white males and 1% of Hispanic males (KCHFS, 2013).
Similar trends exist among females with HIV. More females were diagnosed with HIV infection in their 30s (491, 33%) than any other decade. Similar percentages of black females and white females were diagnosed in that same decade of life. The highest percentage of Hispanic females was diagnosed with HIV in their 20s (41%). Hispanic females tend to be younger at the time of diagnosis than their racial and ethnic counterparts (KCHFS, 2013).
The majority (65%) of cumulative male HIV infections were reported with MSM as the primary route of exposure, while among women, the majority (51%) were exposed through heterosexual contact with a person with HIV or at high risk for HIV contraction, e.g., a person who injects drugs. Minority males (15% of black males and 11% of Hispanic males) reported higher percentages of IDU as the route of transmission, in comparison to non-minorities (6% of whites). Conversely, a higher percentage of white males (73%) reported MSM as the primary route of transmission in comparison to 51% of all black males and 49% of all Hispanic males. The majority of female cases within each racial/ethnic group were infected through heterosexual contact (KCHFS, 2013).
After factoring in the female heterosexual contact as a risk category, a higher percentage of infections with undetermined routes of transmission exists among males (12%) than females (9%). Hispanic males (25%) and black males (17%) have higher percentages of cases without an identified risk factor than white males (9%). The existence of large percentages of infections without known routes of transmission poses a barrier to provision of effective responses to the epidemic within the groups in question, because risk factor information forms the basis for program planning and service provision and guides resource allocation (KCHFS, 2013).
In 2010, Kentucky ranked 25th among the 46 states having confidential name-based reporting, with an estimated HIV diagnosis rate of 9.0 per 100,000 population. Florida had the highest HIV diagnosis
rate in 2010 at 31.2 per 100,000 population, and North Dakota had the lowest rate at 2.0 per 100,000 population (KCHFS, 2013).
Continue on to Transmission
of HIV
|
|